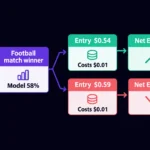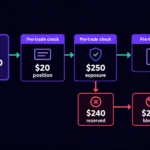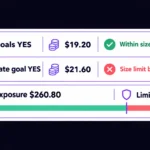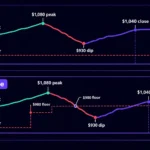


The expected value trading formula is EV = probability of winning × net profit if successful − probability of losing × loss if unsuccessful. Subtract trading costs as well: positive EV means a positive estimated average outcome under your assumptions, not a guaranteed profitable position.
The difficult input is usually your probability estimate, not the arithmetic. This guide connects prices, costs and uncertainty; for the broader process of choosing and managing markets, start with How to Build a Prediction Market Trading Strategy.
What does the expected value formula actually measure?
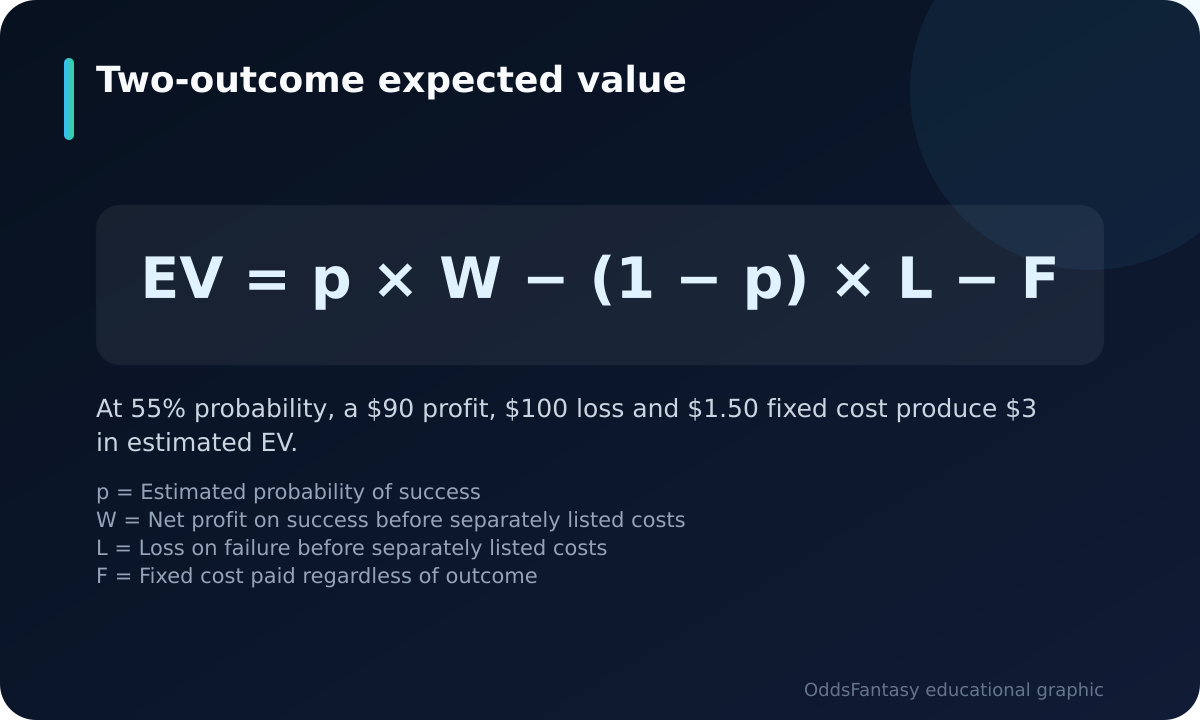
Expected value is the probability-weighted average of a position’s possible net outcomes. For a two-outcome position with a fixed cost, use EV = p × W − (1 − p) × L − F.
- p is your estimated probability of success; 1 − p is the probability of failure.
- W is the net profit on success before the separately listed costs, and L is the loss on failure.
- F is the total cost paid regardless of outcome. If costs differ by outcome, include them within each outcome instead.
A market price is not independent proof of your estimate. Decimal odds imply a break-even probability of 1 divided by the odds before additional costs. The odds to probability calculator helps with that conversion, but establishing a different, defensible probability remains your job.
How do you calculate EV from sports odds?
Worked example: consider a $100 sports position at decimal odds of 1.90 and, separately, a prediction-market position of 100 shares priced at $0.52. All prices, probability estimates and cost assumptions below are hypothetical, not live quotes or current fee rates.
For the sports position, assume a 55% chance of success and no push or void outcome. Decimal odds of 1.90 return $190 on success, including the original $100. The net profit is therefore $90; the unsuccessful outcome loses $100.
Before additional costs, EV = 0.55 × $90 − 0.45 × $100 = $4.50. That is a 4.5% expected return on the $100 position under the stated probability estimate. It does not mean the position will produce $4.50: its two outcomes are a $90 profit or a $100 loss.
If a fixed $1.50 cost applies regardless of the result, net EV falls to $3.00. The break-even probability rises from 52.63% before that cost to approximately 53.42%, calculated as ($100 + $1.50) ÷ $190.
Use the expected value calculator to check the outcome-weighted calculation. Keep the original stake separate from profit, and verify whether any costs you enter are already reflected in the returns.
How does EV work for prediction-market shares?
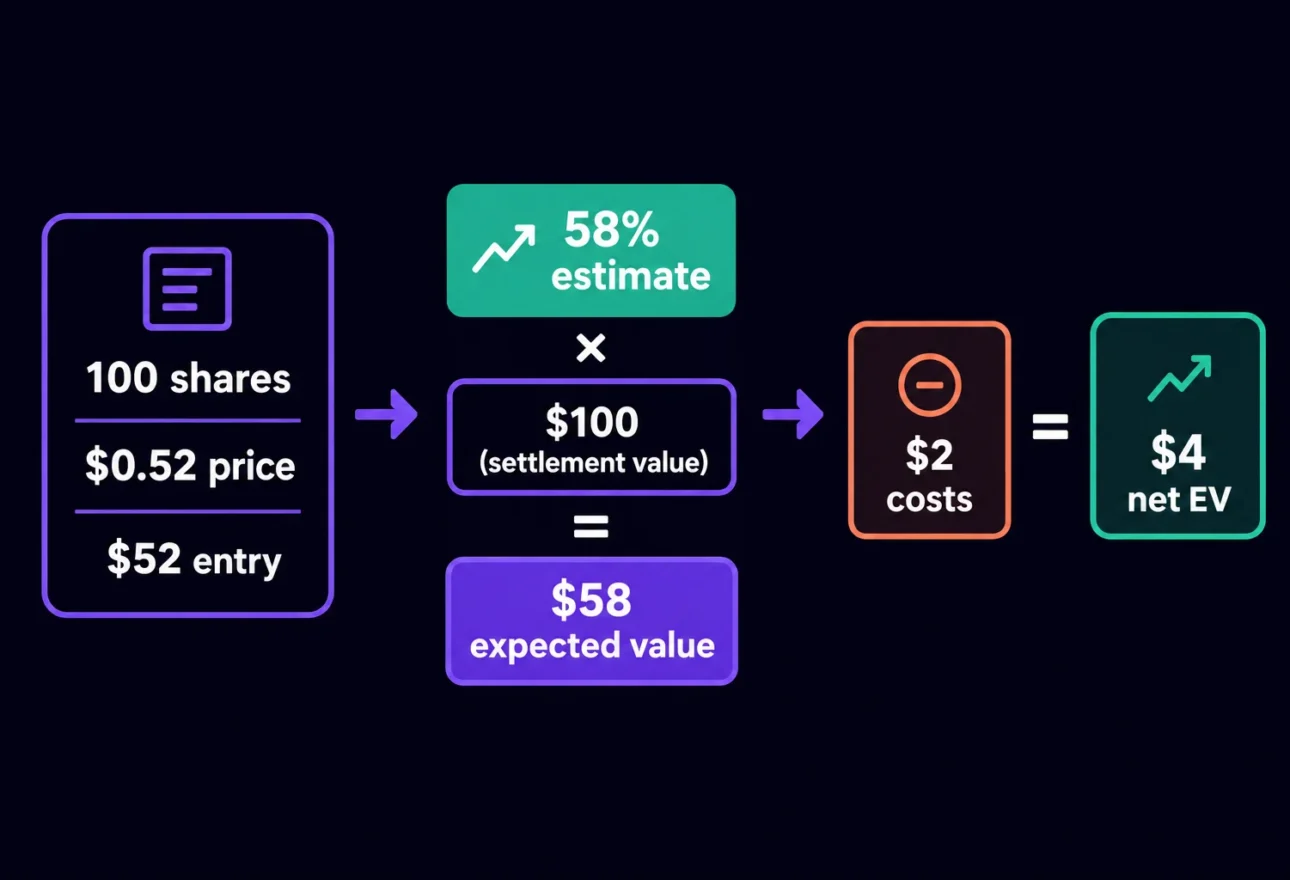
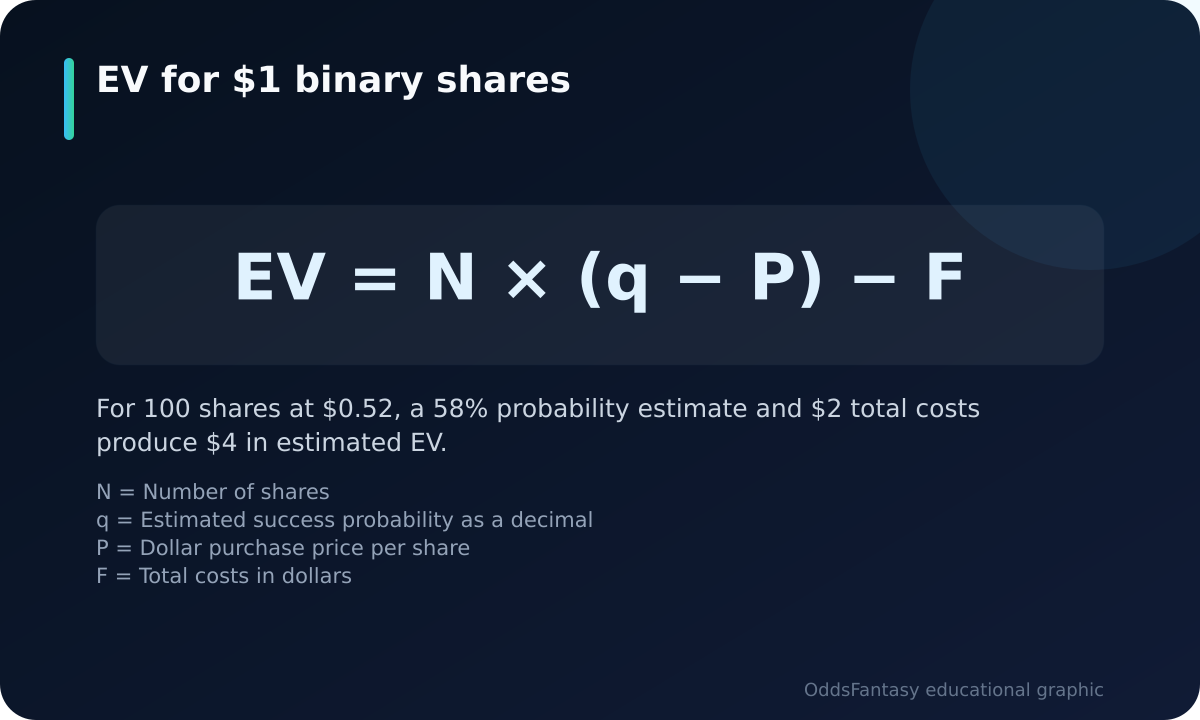
For a binary contract that pays $1 if the selected outcome occurs and $0 otherwise, buying 100 shares at $0.52 costs $52. At an estimated 58% outcome probability, the expected settlement value is 100 × 0.58 × $1 = $58.
The expected profit before costs is $58 − $52 = $6. Assume total costs of $2: net EV becomes $4. At settlement, however, the position produces either a $46 net profit or a $54 net loss after those costs—not a certain $4 gain.
For shares paying $1 or $0, the compact formula is EV = N × (q − P) − F, where N is the share count, q is your estimated success probability, P is the dollar price per share, and F is total costs. Here, 100 × (0.58 − 0.52) − $2 = $4.
This calculation assumes you hold through settlement under the stated contract rules. If your strategy exits earlier, model the probabilities of different exit prices and their costs instead; the outcome probability alone does not determine your exit profit.
How should trading fees enter the calculation?
Use the fee rules for the actual venue and market. The Polymarket trading-fee documentation gives the formula fee = C × feeRate × P × (1 − P), where C is shares traded and P is share price. It states that only takers pay fees; makers are not charged.
To demonstrate that formula alone, a hypothetical feeRate of 0.04 on 100 shares at $0.52 produces 100 × 0.04 × 0.52 × 0.48 = 0.9984 USDC. This is separate from the $2 total-cost assumption above. The formula gives the same dollar fee at complementary prices, such as $0.48 and $0.52.
The documentation also specifies five-decimal-place rounding, with sufficiently small fees rounding to zero. Check applicability and rounding rather than treating this formula as a universal fee schedule. Include relevant entry and exit fees, and use executable prices so spread or slippage is not ignored or counted twice.
Where should your probability estimate come from?
Your probability needs a reason beyond disagreement with the quote. For college football, Converting College Football Point Spread Differentials to Probabilities describes a method combining betting lines and the trader’s view of the outcome. It adjusts normal-distribution probabilities with historical data so more common point differentials receive appropriate weight.
The practical lesson is specific: an expected scoring margin is not automatically a probability of covering a spread. You also need an outcome distribution appropriate to the market. The paper provides a free online implementation, but its college-football method should not be assumed to transfer unchanged to other sports.
How can you check whether probabilities are useful?
The PLOS ONE paper Probabilistic forecasting of replication studies discusses calibration, discrimination and sharpness. Although its application is scientific replication rather than sports trading, these distinctions help explain what to inspect in a forecast record:
- Calibration: do outcomes assigned similar probabilities occur at roughly those frequencies across a sufficiently informative record?
- Discrimination: does the model distinguish more likely outcomes from less likely ones?
- Sharpness: how concentrated or decisive are the forecasts? Confidence is useful only when supported by forecast quality.
The paper also accounts for uncertainty within studies and differences between studies. For trading, the analogous caution is to avoid assuming historical conditions perfectly match today’s event. Record the estimate, its rationale and a plausible range before seeing the result.
Does your estimated edge survive probability uncertainty?
Keep the prediction-market position fixed at 100 shares, a $0.52 entry price and $2 total costs. Estimated EV is −$4 at a 50% probability, $0 at 54%, $4 at 58%, and $8 at 62%. The price has not changed; only your assumption has.
The cost-adjusted break-even probability is 54%, calculated as $0.52 + $2 ÷ 100. If your defensible probability range extends below 54%, your conclusion is sensitive to estimation error. That does not prove the trade is bad, but it weakens any confident claim of positive EV.
How can OddsFantasy tools help you check a position?
- Convert the quote into implied probability, then write down your own probability and supporting reasoning separately.
- Check EV using net outcome profits and losses, including relevant costs without double-counting them.
- Repeat the calculation at less favorable probabilities and executable prices. Identify exactly where EV turns negative.
- Use trading simulators to rehearse scenarios before taking exposure. Compare the assumptions you recorded with the outcomes you later observe.
The OddsFantasy Sports Trading Tools Suite includes a Positive EV Finder, trading calculators including ROI and exposure, trading simulators, price comparison, risk management utilities and a trading analytics dashboard. These support checking and reviewing a trade; they do not make an uncertain probability estimate correct. The suite costs $79.99 a month or $499.99 a year.
For a structured introduction to odds, probability, positive EV and exposure, the Beginner’s Guide to Data-Driven Sports Trading covers those fundamentals alongside market psychology and common trading mistakes.
Does positive EV justify taking the position?
Not by itself. A positive estimated average does not limit the loss on the next trade, and several positions can depend on the same event. Check position size, combined exposure and applicable account risk rules separately from EV.
A usable trade record should preserve four things: the executable price, the probability estimate, the cost calculation and the exposure decision. That lets you distinguish a calculation error, a weak forecast and an ordinary losing outcome without rewriting your reasoning afterward.
Frequently asked questions
What is the expected value trading formula?
For two outcomes, EV = p × W − (1 − p) × L − F. Here, p is the probability of success, W is net profit on success before separately listed costs, L is the loss on failure, and F is a fixed cost paid regardless of outcome.
Does positive expected value guarantee a profitable trade?
No. Positive EV is a positive estimated probability-weighted average, conditional on your inputs. An individual position can lose, and inaccurate probabilities or omitted costs can make the estimate misleading.
How do you calculate EV for a prediction-market share?
For a share paying $1 on success and $0 otherwise, EV = N × (q − P) − F. N is share count, q is estimated success probability, P is the dollar entry price, and F is total costs. This formula assumes holding through settlement.
What if my probability estimate is uncertain?
Calculate EV across a defensible range rather than using only one probability. Find the cost-adjusted break-even probability and check whether plausible estimates fall below it. A narrow estimated edge can disappear with a small forecasting error.
Should spread and slippage be subtracted from EV?
Account for execution effects, but avoid double-counting. If your calculation already uses the actual executable purchase and sale prices, those prices reflect the spread. If it uses a reference quote, adjust for the execution price you reasonably expect.
Sources
- Polymarket: Trading Fees | Polymarket Help Center
- PLOS ONE: Probabilistic forecasting of replication studies
- arXiv: Converting College Football Point Spread Differentials to Probabilities
Trade responsibly: only trade what you can afford to lose. 18+.